This analysis involved assessing the flood risk to metro Vancouver in the event of a stormsurge. This is an event that includes rising sea levels as a result of changes in atmospheric pressure and have become a greater threat due to climate change. To assess the risk, a series of maps were created to depict different areas and infrastructure that is at risk. The first four maps all use a Digital Elevation Model (DEM) of metro Vancouver with a 25m resolution. The first two maps show different areas of metro Vancouver that are colour coded based on their elevation. Areas coloured blue represent the lowest elevation and thus are at the highest risk. The third map isolates areas of low (<6 meter) elevation that are also within 1 km of the shoreline. The fourth map depicts roads that are at greatest flood risk because they lie in the highest risk areas. Finally, the fifth map is specific to the False creek tidal flats and uses a more detail DEM with a 1m resolution. This map shows schools and outlines the proposed site of the new St. Paul’s Hospital, to show how it could be affected by flooding. As mentioned, the majority of this analysis was done with a 25m resolution DEM, so this could cause some accuracy errors, depending on the level of precision required. Accuracy of the low elevation areas can only be claimed to within 25 meters.
GEOB 270 Lab 3-Storm Surge Spatial Analysis
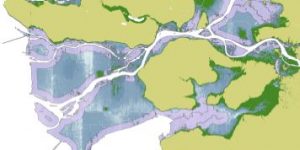
This geographic analysis assesses the risk of storm surges in Vancouver and attempts to show which areas of the city would be the most impacted.