Data Classification
When representing the census, there are different choices for the method of data classification. As shown here: DataClassification , the method chosen can greatly impact the interpretation of the data. The standard deviation method shows areas both above and below the mean value of the dataset. The manual breaks method allows the author of the map to break the data into any number of categories and set the range for each category based on their interpretation of the data. The equal interval classification groups the data into categories that all have the same range size. Finally, the natural breaks method uses statistical techniques built into the ArcMap software that group data with similar values and tries to accurately represent the distribution of the data.
Data Uncertainty
When obtaining data by census tract or dissemination areas, some will have no data available and will have a value of 0 listed. This may be because the data is suppressed from publication by Statistics Canada due to privacy restrictions, but it can also be because that variable (i.e. housing cost) is not available for that area (i.e. a commercial area). When conducting analysis, these 0 values were excluded so they did not artificially distort the results.
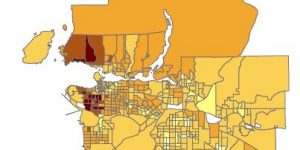
Cost of Housing
The map shown here: HousingCost , represents that shelter cost in Vancouver vs. Montreal. This is obtained from the 2016 Canadian Census and uses the cost of purchased homes by census dissemination area. The problem with only using this variable is that it doesn’t account for alternative housing costs, such as rent, and it also does not standardize based on income.
In this second map, shown here: HousingAffordability , we look at affordability for the same area. Affordability uses a standard ratio method to assess housing cost and income together. This is a better measure than housing cost alone because it standardizes for income and, as a result, assesses affordability based on the proportion of personal budget needing to be spent on housing. This ratio method was taken from published literature (http://www.demographia.com/dhi.pdf), and can be trusted because it minimizes the ability to misrepresent data by calculating affordability as a multiple of median income, which standardizes it for use across the world, even between areas with large differences in GDP per capita. I think affordability is a decent indicator of a city’s livability, but it should not be considered in isolation. For example, many other factors such as safety, access to nature, congestion, and traffic would also be factors when considering livability.